景象匹配导航(SMN,scene matching navigation)作为一种辅助导航方式,以其设备轻便、信息量大、无源等显著优点,得到飞行器导航领域的广泛关注[1, 2, 3]。若将SMN得到的位置信息直接用于修正惯性导航系统(INS,inertial navigation system),而不考虑该匹配结果的可靠性,即匹配概率,将会影响INS位置误差修正结果的可靠性[4]。景象匹配导航的匹配概率计算主要有基于约翰逊假设的计算方法[5, 6],该方法其中有一条假设是:实时图被认为是基准图附加了满足平稳各态历经的高斯过程噪声。在实际飞行过程中,由于受复杂环境下各种因素的影响,实时图通常不满足该假设,从而导致计算不准确。
文献[7]研究INS/SMN的组合导航方法,解决导航精度问题,并假设SMN误差统计特性为固定方差的白噪声。在实际中,由于飞行运动及环境的变化,实时图与地标点图存在各种畸变,SMN的误差统计特性是不确定的,将其简化为固定方差的白噪声会造成量测模型不准确,从而影响组合导航性能。文献[8, 9]对影响SMN误差统计特性的因素进行了定性分析,不同飞行运动及环境下误差统计特性定量建模研究未见报道。如果通过离线分析并建立在不同飞行运动及环境的SMN的导航误差统计特性模型,并进行在线预测,进一步与INS进行组合导航,将是提高INS/SMN组合导航的性能的一条有效途径。本文提出复杂飞行运动及环境下基于机器学习的SMN匹配概率及匹配误差统计特性建模与预测方法。
1 基于机器学习的SMN匹配概率及误差统计特性建模 1.1 算法框架基于机器学习的SMN匹配概率及误差统计特性建模算法框架如图 1所示,分为模型训练和预测两部分。在模型训练部分,将飞行器飞行运动或环境参数、匹配之后的性能指标作为机器学习训练器的输入,匹配概率(Pc)、匹配误差均值(μ)、匹配误差方差(σ2)作为机器学习训练器的输出,离线训练出匹配概率与量测误差参数模型。在预测部分,获取当前的飞行器飞行运动或环境参数和匹配之后的性能指标,通过离线训练的模型在线预测当前帧的匹配概率及误差参数,根据系统需求设定匹配概率阈值P0,当Pc<P0,放弃该帧实时图,当Pc≥P0,则进行误差建模,将预测得到的μ、σ2作为景象匹配量测误差模型参数,输出给量测方程。

|
| 图 1 算法框架 |
本文针对飞行器运动过程中产生的航空像移,即速高比变化下的运动模糊,采用SVM作为机器学习方法,对提出的算法进行实验分析。
1.2 速高比变化下的运动模糊分析当视觉传感器运用到景象匹配导航时,不同程度的运动模糊会带来不同的导航误差,影响导航精度,严重时,不得不放弃景象匹配导航。
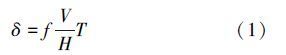
如果确定曝光时间T,根据几何关系可以算出像移量δ与相机焦距f、飞行速度V、飞行高度H:

采取的匹配算法是归一化互相关[10]。
1) 最高峰(Vmax)
相关面上的最高值对应最高峰,通常最高峰位置被当做是最匹配位置。
2) 峰值比(R)
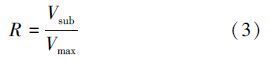
衡量匹配可靠性的一个常用的指标是匹配概率(Pc)。
航拍图像的匹配位置(xip,yip)与准确位置(xiz,yiz)的绝对误差A定义为

评判地标点与实时图是否匹配正确的依据是:根据导航精度要求设置阈值D,当地标点与实时图匹配的绝对误差A>D时,认为匹配错误;当A≤D时,认为匹配正确。
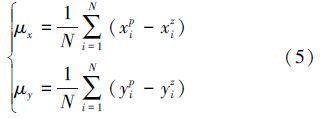
1.5 组合导航中量测误差统计特性分析本文通过SVM学习速高比变化带来的图像不同模糊下景象匹配量测误差统计特性(μ、σ2)。μ与σ2的定义如下:
1) 均值(μ)
对N幅图像的匹配位置(xip,yip)与准确位置(xiz,yiz)的差在x,y方向的均值分别为:
本文采用t检验对样本匹配结果进行零均值验证。
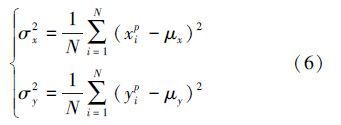
2) 方差(σ2)
x,y方向需要分开考虑,对N幅图像的匹配位置(xip,yip)与准确位置(xiz,yiz)在x,y方向的方差分别为:
本文模糊方向设为0°,即仅在x轴方向有运动模糊,误差参数只考虑x轴的μ和σ2,其它方向上本算法框架同样适用。
2 实验结果及分析 2.1 模型训练1) 数据库制备
选择google earth上从陕西咸阳到山西大同320 km的航迹上308幅正下视实时图,拍摄时刻为2013.8.30 ,飞行高度为2 000 m,将其裁剪成900像素*500像素大小。地标点的制备直接从实时图获取,在实时图上选择地物显著、信息量丰富、稳定性好的256像素*256像素的小区域,作为地标点,将其中心在实时图的像素坐标系上的真实位置作为准确位置。然后在每幅实时图上分别加1~50像素的模糊大小,共计308*51张实时图和308张对应地标点,构成实验中图像数据库。
2) 匹配性能分析
(1) B与A、Vmax和R的关系分析
将不同模糊大小的实时图与对应地标点匹配后,对不同模糊下308幅实时图与地标点匹配后的Vmax求平均,得到平均最高峰$\bar{V}$max,然后计算R和A,并求平均,得到平均峰值比和平均绝对误差。表 1是实验得到的3个特征值(模糊大小1~50个像素,由于表格位置有限,仅给出部分值)。
| B/像素 | ${\bar{A}}$/像素 | ${\bar{V}}$max | ${\bar{R}}$ |
| 1 | 0 | 1.000 | 0.623 |
| 5 | 0 | 0.944 | 0.724 |
| 10 | 0 | 0.870 | 0.880 |
| 15 | 0.052 | 0.809 | 0.947 |
| 20 | 0.276 | 0.758 | 0.972 |
| 25 | 0.647 | 0.713 | 0.983 |
| 30 | 1.117 | 0.674 | 0.989 |
| 35 | 1.805 | 0.638 | 0.992 |
| 40 | 2.682 | 0.606 | 0.994 |
| 45 | 3.820 | 0.577 | 0.996 |
| 50 | 5.120 | 0.552 | 0.996 |
由表 1可以看出,B由1增加到50个像素过程中,由0增加到5.120个像素。即随着图像模糊的增加,匹配精度越差;B由1增加到50个像素过程中,max由1减小到0.552,由0.623增加到0.996。即随着图像模糊的增加,图像的匹配性能下降。
(2) 运动模糊影响下的Pc
根据匹配后计算得到的A,在阈值D为5个像素,随着图像模糊的增加,Pc的变化曲线由如图 2所示。

|
| 图 2 阈值为5时的匹配概率随模糊大小变化曲线 |
由图 2可以看出,模糊由1增加到50个像素过程中,匹配概率由100%减小到84%,即匹配概率随模糊大小的增加而减小。在实际运用时,可以根据系统对精度的需求设置D,得出实时匹配概率的变化曲线。
3) 景象匹配误差统计特性分析
(1) 均值是否为零验证
根据(5)式计算x方向上的均值,假设μ0=0,对地标点误差进行t检验。
实验表明|T|均在接受域内,所以认为景象匹配误差噪声可以看成均值为零的高斯分布。
(2) 方差
根据(6)式计算x方向的方差,由实验可以得出,模糊由1增加到18个像素过程中,σ2保持为0,当模糊由18增加到50个像素过程中,方差随模糊呈非线性增加,由0增加到52。
由以上分析可知,SMN匹配概率与量测误差参数预测模型是合理的。
2.2 误差参数预测为了验证上一节训练得到的匹配概率及误差参数模型的有效性,进行数据库独立验证。从google earth重新截取了77张实时图(与模型训练时所用数据库内的实时图不重复),在每幅实时图选取地 物显著的地标点,并在每张实时图上加1~50个像素的运动模糊,将不同模糊的实时图与对应地标点匹配。
由图 3可以看出,当运动模糊小于40个像素,阈值为5时匹配概率预测值与统计值的均方根误差小于0.004,方差预测值与统计值的均方根误差小于1个像素,能保证较高的预测精度。

|
| 图 3 不同模糊下预测值与统计值的均方根误差 |
给出了基于机器学习的匹配概率及误差统计特性建模算法框架,通过训练得到景象匹配的匹配概率和量测误差参数预测模型。
| [1] |
冷雪飞. 基于图像特征的景象匹配辅助导航系统中的关键技术研究[D]. 南京:南京航空航天大学, 2007 Leng X F. The Key Technologies Study of Scene Matching Aided Navigation System Based on Image Features[D]. Nanjing, Nanjing University of Aeronautics and Astronautics, 2007(in Chinese) |
| Cited By in Cnki (25) | |
| [2] |
赵锋伟,李吉成,沈振康. 景象匹配技术研究[J]. 系统工程与电子技术, 2002, 24(12):110-113 Zhao F W, Li J C, Shen Z K. Study of Scene Matching Techniques[J]. Systems Engineering and Electronics, 2002, 24(12):110-113(in Chinese) |
| Cited By in Cnki (97) | |
| [3] | Kim Y S, Hwang D H. Design of Vision/INS Integrated Navigation System in Poor Vision Navigation Environments[C]//International Conference on Control, Automation and Systems, 2013:531-535 |
| Click to display the text | |
| [4] | Dong-Gyu Sim D G, Rae-Hong Park R H, Kim R C, Lee S, et al. Integrated Position Estimation Using Aerial Image Sequences[J]. IEEE Trans on Pattern Analysis and Machine Intelligence, 2002,24(1):1-18 |
| Click to display the text | |
| [5] | Johnson M. Analytical Development and Test Results of Acquisition Probability for Terrain Correlation Devices Used in Navigation Systems[C]//10th Aerospace Sciences Meeting, San Diego, USA, 1972 |
| Click to display the text | |
| [6] |
王刚, 段晓君, 王正明. 基于图像区域相关的景象匹配概率与精度研究[J]. 宇航学报, 2009, 30(3):1237-1242 Wang G, Duan X J, Wang Z M. Research on Acquisition Probability and Matching Precision of Scene Matching Systems Based on Area Correlation of the Image[J]. Journal of Astronautics, 2009, 30(3):1237-1242(in Chinese) |
| Click to display the text | |
| [7] | Yun S C, Lee Y J, Sung S K. IMU/Vision/Lidar Integrated Navigation System in GNSS Denied Environments[C]//IEEE Conference on Aerospace Conference, Big Sky, MT, 2013:1-10 |
| Click to display the text | |
| [8] | Chen P, Hsu S C, Lee G W. Error Modelling on Registration of High-Resolution Satellite Images and Vector Data[C]//Proceedings of the Congress of International Society for Photogrammetry and Remote Sensing, Netherlands, 2004:12-23 |
| [9] | Ratkovic J A, Blackwell F W, Bailey H H, et al. Estimation Techniques and Other Work on Image Correlation[R]. Rand Corp Santa Monica Calif, 1977 |
| Click to display the text | |
| [10] | Lewis J P. Fast Normalized Cross-Correlation[C]//Vision Interface, Quebec City, French, 1995, 10(1):120-123 |
| Click to display the text |